Submit
Affordable Plan
Get Featured Here
Need Infographics?
Infographic Maker
Infographic Templates
Social Media
Mobile
Facebook
Google Plus
LinkedIn
Twitter
Business
Health
Tech
Photography
E-commerce
SEO
Misc
Politics
Science
Tips
Travel
Contact
Partner with Us
Privacy Policy
Terms of Use
Takedown Notice
Connect with us
Best Infographics
Submit
Templates
Tech
How the World Spends 7B hours [Infographic]
Which Industries Contribute the Most to America’s GDP?
Cost of 1 Hour Downtime to Businesses [Infographic]
Most Valuable Sports Teams Infographic]
Most Popular Used and New Vehicles by State [Infographic]
Social Media
Most Popular Social Media Platform for Each Age Group?
Best Cities for Instagram Influencers [Infographic]
Facial Expressions That Attract the Most YouTube Views [Infographic]
The Most Hated Social Media Apps [Infographic]
American Sports Stars That Earn The Most from Instagram [Infographic]
Contact
Takedown Notice
Privacy
Terms of Use
All posts tagged "ai"
Business
Dangers of Internet of Things [Infographic]
By
cyrus
September 14
Technology
Life After AI [Infographic]
By
cyrus
July 5
Technology
How AI is Making Humans Smarter [Infographic]
By
cyrus
July 3
Technology
The Role of AI In Customer Experience
By
cyrus
June 22
Technology
21 Technology Tipping Points We Will Reach By 2030
By
cyrus
May 5
Technology
Rise of Police & Law Enforcement Drones
By
cyrus
March 13
Technology
7 Industries Impacted by AI
By
cyrus
January 17
Featured
Poker & AI: Rise of the Machines [Infographic]
By
cyrus
December 11
Social Media
Siri vs. Google Assistant [Infographic]
By
cyrus
December 23
More Posts
Page 8 of 8
1
2
3
4
5
6
7
8
Submit Your Infographic!
Trending Infographics
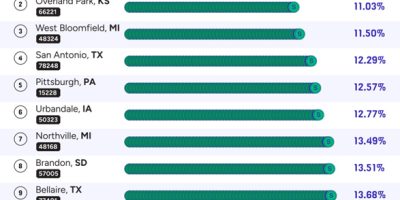
The Most Affordable Zip Codes to Rent [Infographic]
Uses & Applications of Drones {Infographic}
The Highest Rated Computer Parts [Infographic]
The Cost of Broadband Internet to Download Speed in Every Country [Infographic]
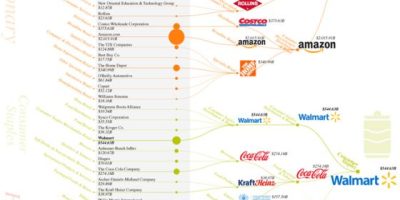
Largest Company by Market Cap In Every Sector [Infographic]
Most Asked Job Interview Questions [Infographic]
Theoretical Limits Visualized [Infographic]
To Top