


Technology
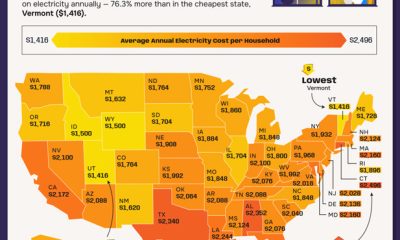
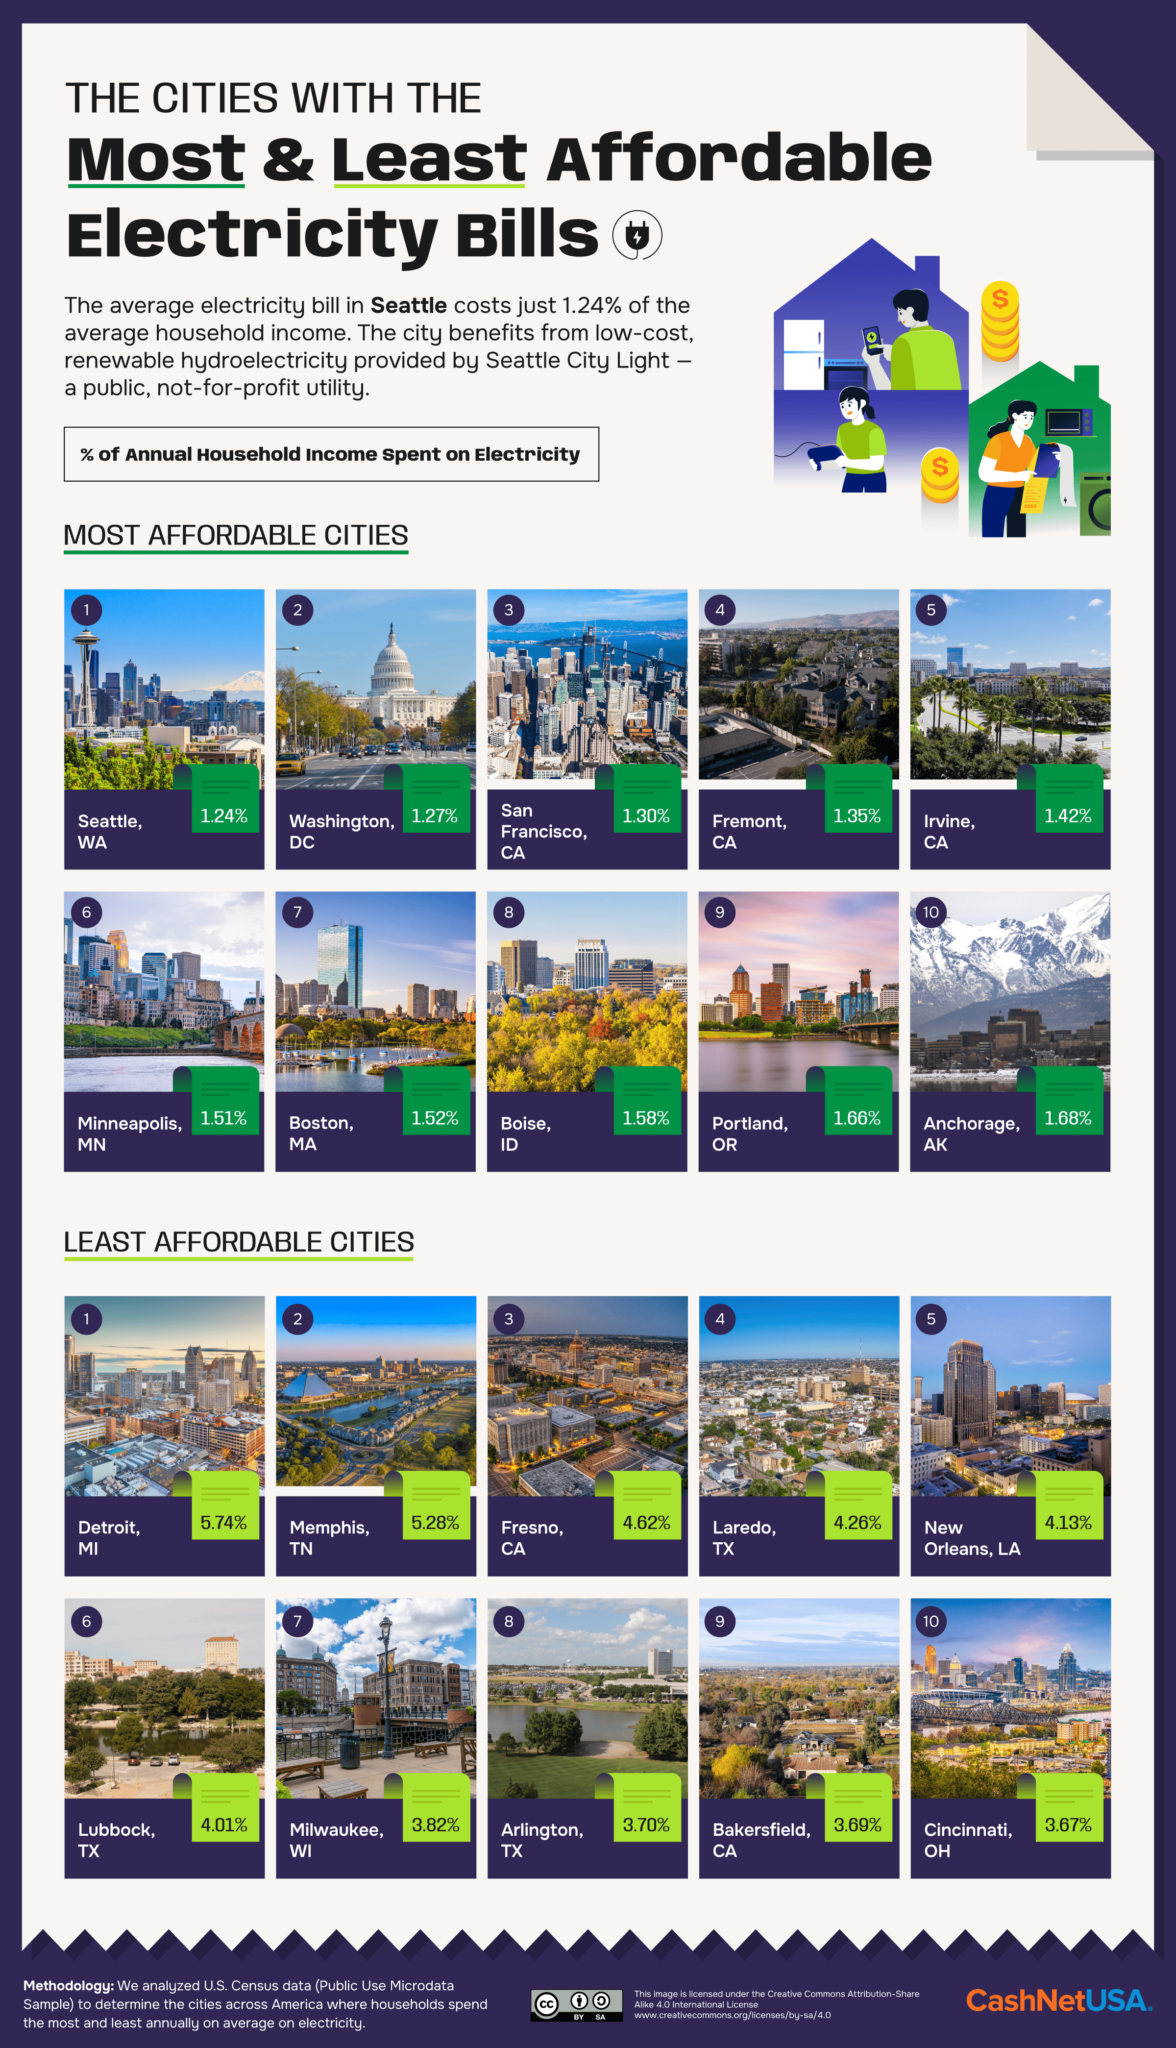
Cities with Least Affordable Electricity Bills [Infographic]
Published on
Nobody enjoys having to put up with the rising costs of living. It is especially annoying to pay so much money on gas and electricity. Depending on where you live, you could end up paying even more as this infographic from CashNetUSA shows:
SEMRush ➡️ Rank Higher with Smart Keyword Research
***Disclaimer: Our articles may contain affiliate links. Please read our disclaimer on how we fund this site. As an Amazon Associate, we earn from qualifying purchases.


![4 Signs You Need Tooth Extraction [Infographic]](https://www.best-infographics.com/wp-content/uploads/2019/10/30/4-Signs-You-Need-Tooth-Extraction-400x200.jpg)
![Are You Prepared for Flooding? [Infographic]](https://www.best-infographics.com/wp-content/uploads/2018/03/28/Are-You-Prepared-for-Flooding-scaled-400x200.jpg)
![The Biggest Public Companies Mapped [Infographic]](https://www.best-infographics.com/wp-content/uploads/2022/04/12/The-Biggest-Public-Companies-Mapped-400x200.jpg)


