Business
5 Ways Graphs Can Be Used to Mislead [Infographic]
Published on
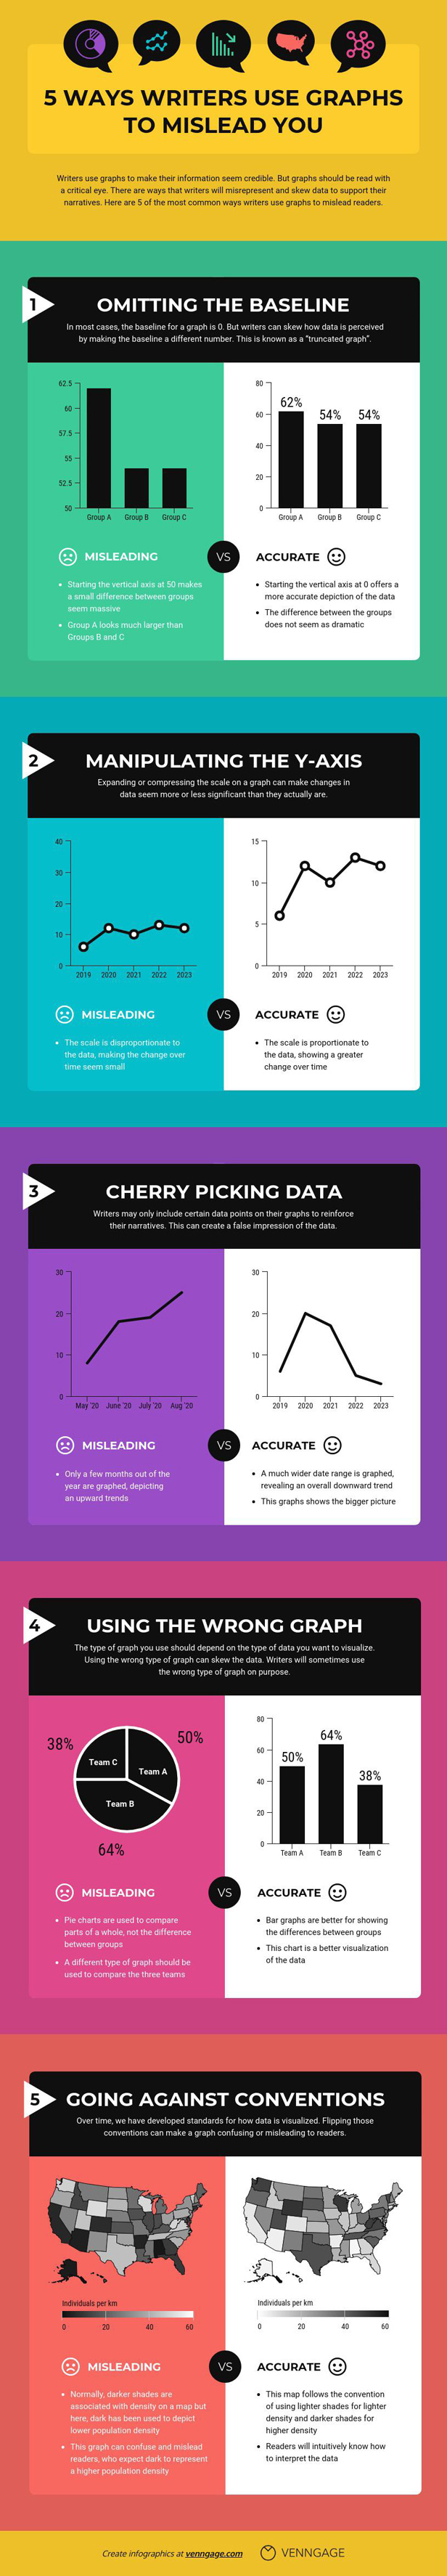
 We all know the importance of having access to accurate data and information. Unfortunately, it is always possible to use charts to turn accurate data into misleading information. This infographic from VENNGAGE covers 5 ways graphs can be used to mislead:
You may also want to see:


![How to Choose an Air Purifier? [Infographic]](https://www.best-infographics.com/wp-content/uploads/2017/04/10/air-purifier-buying-guide-scaled-400x200.jpg)